
What I Learned from Week One

It’s been one week since my first post, which was really just an announcement of posts to come. The newsletter will probably settle into a groove of 2-3 posts per week as I get going. In the first week, though, I was really interested in what would happen when I posted.

One of the coolest things I’ve found is the analytics available on Substack. I can see email open rates, how many views the newsletter gets, and where traffic comes from.
If you’re reading this it means you’re a writer or a publisher, or at least curious about it all, so let’s dive in. I’d love to get questions—by comment, email, LinkedIn, or Twitter—if you think there’s anything I could be learning from the existing analytics, or any specific experiments I can run in my posts.
Week One Traffic: Posts
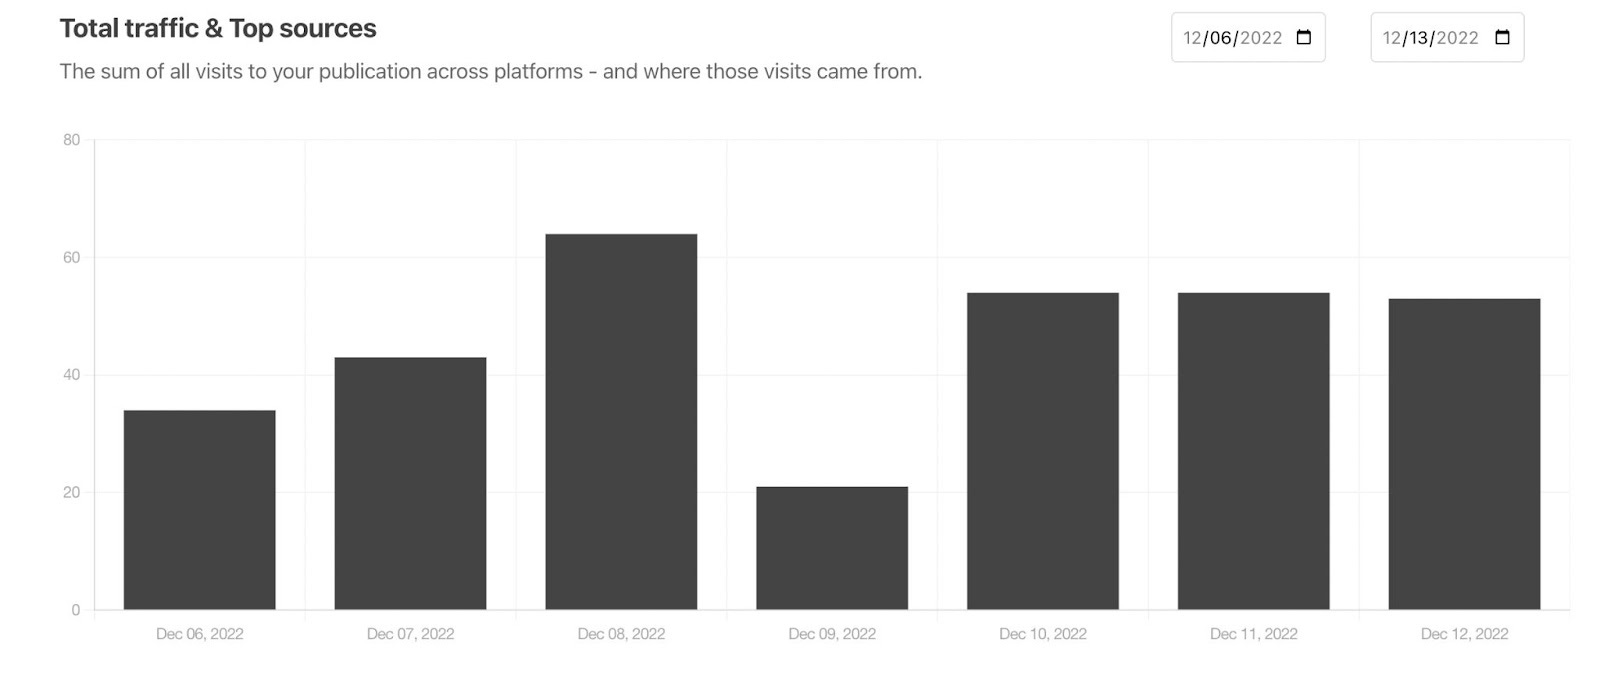
Posts are mostly getting around 50+ views each, so far. The low day, December 9, is a day I didn’t post anything. After that I decided to post every day for the rest of the week so I could gather some more data.
The day with the largest number of views was December 8, when I wrote about Fast Company’s Best Book Covers of 2022. 43 people read that post. Only one person clicked the link to the original article on Fast Company’s website. But another 20+ people visited the newsletter that day.
On the 10th and 12th I posted How to Make an Impact: Part 1 (my most read individual post thus far with 53 reads) and How to Make an Impact: Part 2, which are far more substantial than any of the other posts. I also think they’re pretty important for anyone who’s looking for a kick in the pants to write a book. I honestly expected yesterday’s post, part 2, to get a lot more traffic than it did.
The results being a bit flat (44 reads after 1 day) might tell me something useful. Either people don’t like to read newsletters on Monday, or people don’t like posts that are mostly text, or…
With that said, let’s get to another picture!
Week 1 Traffic: Sources
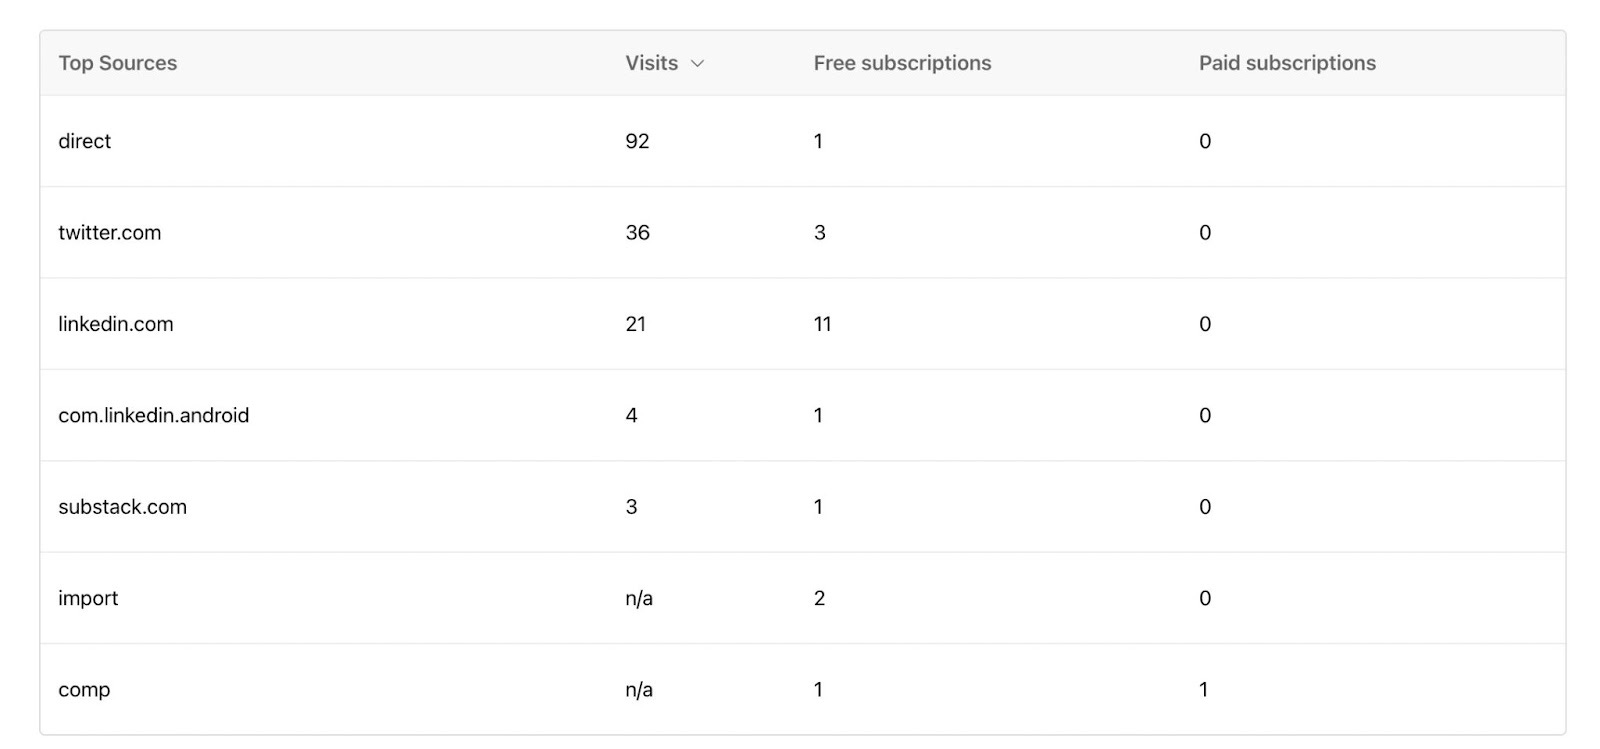
First, I’m pretty sure the “paid subscription” you see here is me. I don’t know why it shows up that way. One very cool thing about looking at this is how many visits the newsletter has gotten already.
I think the “direct” category means that 92 visits have come from people opening the emails each day.
What’s really fascinating is to look at the numbers for Twitter and LinkedIn—Twitter has driven roughly 50% more visits, but LinkedIn visits have resulted in almost 4x more subscriptions. Will that trend continue? And do I want subscribers more, or visits? I’m not planning to do “marketing” exactly, but if I were, how would this inform my promotional efforts going forward?
It seems like there’s a lot of insight to be gained from this, and no matter what, I’m really glad I finally got started. Since everyone here has signed up for a newsletter that’s at least partially about publishing, I’ll share info like this at intervals as I get better at the whole operation. We’ll see together what works and what doesn’t.
Here’s to curiosity.
